KubeAstra
Health Uyari
- License — License: Apache-2.0
- Description — Repository has a description
- Active repo — Last push 0 days ago
- Low visibility — Only 5 GitHub stars
Code Uyari
- network request — Outbound network request in cli/src/kubeastra/cli.py
Permissions Gecti
- Permissions — No dangerous permissions requested
Bu listing icin henuz AI raporu yok.
AI-powered Kubernetes troubleshooting via chat or MCP
Kubeastra






📬 Subscribe for release updates — new versions, no spam
Your clusters are talking. This assistant helps you listen.
An AI-powered Kubernetes troubleshooting assistant that lets teams investigate, diagnose, and resolve cluster issues through natural language — via a chat-based web UI or directly inside your IDE (Cursor / Claude Desktop / VS Code via MCP).
Combines live kubectl access with pluggable LLM providers (Gemini, Ollama/local, more coming) for root-cause analysis that turns cryptic Kubernetes failures into clear answers and actionable fix commands.
See it in action
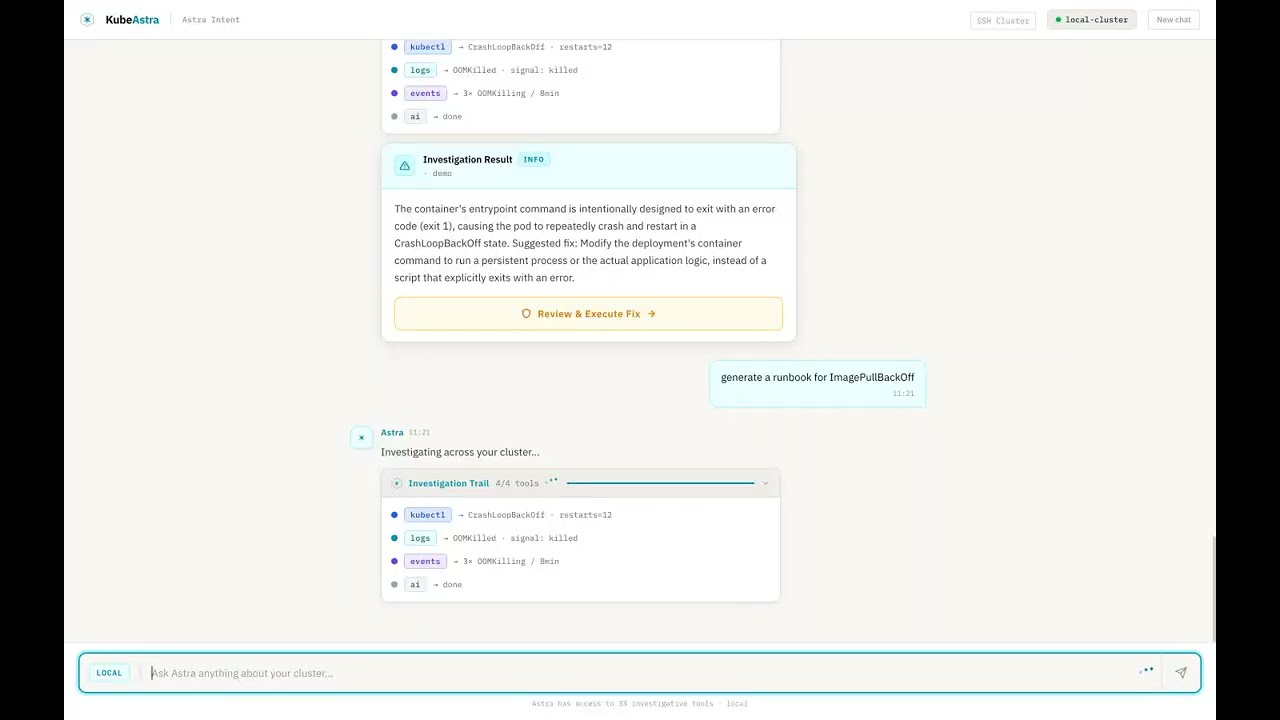
▶ Watch the 90-second demo — Kubeastra walking through 7 real Kubernetes failures (CrashLoopBackOff, OOMKilled, ImagePullBackOff, stuck PVC, unschedulable pod, namespace-wide health, runbook generation).
Want to reproduce it locally?
make demospins up a kind cluster pre-seeded with six broken workloads. Seedemo/README.md.
Why this exists
Every DevOps engineer has been here: a pod is crashlooping at 2 AM, and you're mentally chaining together kubectl get, kubectl describe, kubectl logs, cross-referencing events, checking resource limits, and Googling error messages — all while half asleep.
This tool handles that investigation loop for you:
- Ask in plain English — "Why is payment-service crashing in production?"
- Get root-cause analysis — not just logs, but AI-synthesized explanations of what's wrong and why
- Receive fix commands — ready to run, with safety confirmations for write operations
- Generate runbooks — so your team doesn't debug the same issue twice
- Stay on your own infra — run entirely locally with Ollama, no data leaves your cluster
Key Features
🔗 Connect Any Cluster in Seconds
Four ways to connect — pick what fits your setup:
| Mode | How it works | Best for |
|---|---|---|
| Auto-detect | Reads your local ~/.kube/config and lists available contexts |
Local dev, minikube, kind, Docker Desktop |
| Kubeconfig upload | Paste or upload a kubeconfig file, pick a context | Remote clusters, CI-generated configs |
| SSH | Enter host/user/password — kubectl runs on the remote node over SSH | Air-gapped clusters, bare-metal kubeadm |
| In-cluster | Mounts the ServiceAccount token automatically | When deployed inside the cluster via Helm |
Switch between clusters without restarting. Each session tracks its own connection.
🔍 51 Built-in Kubernetes Tools
Live cluster tools (~30) — pod/deployment/service inspection, event streams, multi-namespace discovery, rollout status, kubeconfig context switching, log retrieval with previous-container support, resource-graph topology, deployment-level investigation, namespace-wide health analysis, and safe write operations (delete, scale, restart, patch — all gated behind dry_run + confirmation_token).
AI analysis tools (~9) — error analysis with RAG-backed similarity search, curated fix playbooks for 11 error categories, AI-generated runbooks, cluster health reports, post-incident summarization, k8sgpt-style pattern matching, RAG knowledge-base search (kb_search).
Helm tools (5) — release listing, revision diffing, release inspection, availability check, guided investigation.
Alerts + observability (2) — Alertmanager fan-in (get_recent_alerts), Prometheus range/instant queries (prom_query).
GitOps / deployment-repo (3) — fetch files, list paths, and grep the deployment repo directly from investigation.
Remediation plans (3) — propose_remediation_plan, get_plan, execute_plan_step (multi-step fixes with per-step confirmation).
🤖 Agentic ReAct Investigation
Unlike single-shot "ask → answer" tools, Kubeastra runs a multi-step ReAct loop — reasoning through complex failures autonomously:
You: Why is checkout-service down?

Agent reasoning:
  ✓ find_workload — searching across all namespaces
  ✓ investigate_pod — found CrashLoopBackOff in checkout-svc-7d4f9b
  ✓ get_pods — checking Redis dependency → ConnectionRefused
  ✓ describe_pod — Redis pod Pending: unbound PVC

Root cause: PersistentVolumeClaim redis-data is unbound,
preventing Redis from starting, which cascades to checkout-service.
Each reasoning step is visible in real-time via the Investigation Trail — no black box. The agent answers listing questions in a single step and complex debugging in 2-3 steps, with a 90-second wall-clock safety timeout.
🔧 One-Click Fix Execution
When the AI identifies a fix, you get a Review & Execute button with the exact commands:
- Only write operations are suggested (delete pod, rollout restart, scale, patch) — never diagnostic commands you've already seen
- Slide-to-confirm safety gate before any command runs
- Button disappears after execution — no accidental re-runs
- When no safe automated fix exists (e.g., "update your Helm values"), the card shows Manual Steps Required with numbered instructions instead
👥 Collaborative Sessions
- Shareable URLs — click Share to copy a session link (
/chat/:sessionId). Anyone with the URL sees the full investigation history — including the root-cause card, fix commands, and evidence. - Investigation timeline — every ReAct step (tool call, thought, observation) renders as a real-time timeline, not simulated placeholders.
- Session not found — invalid or expired shared links show a clear message instead of a blank page.
- One-click post-mortems — generate a structured post-mortem (summary, timeline, root cause, impact, resolution, action items) from any investigation session via the API.
🗺️ Visual Debugging Canvas
The resource graph is an interactive investigation surface, not just a topology diagram:
- Health-aware nodes — pods, services, deployments, and ingresses colored by health status with pulsing red glow for degraded resources
- Click-to-inspect — click any node to see full metadata in a detail panel
- Hover tooltips — quick metadata preview (phase, restarts, IP, ports, replicas)
- Edge labels — see relationships at a glance: "routes →", "selects →", "manages →"
- MiniMap + zoom/pan — navigate large cluster topologies with ease
💬 Two Ways to Use It
| Web UI | IDE / MCP Integration |
|---|---|
| Chat-based Next.js interface for team-wide troubleshooting | Direct integration into Cursor, Claude Desktop, or any MCP client |
| Connect any cluster (auto-detect, kubeconfig upload, SSH) | Debug without leaving your editor |
| Shareable session URLs with persistent chat history (SQLite) | 51 tools available via stdio or HTTP MCP transport |
| Visual resource graph with click-to-inspect | Same ReAct agent powers both surfaces |
🚨 Alert-Driven Auto-Investigation
Point Alertmanager at KubeAstra and it auto-triages incoming alerts:
- Webhook receiver —
POST /api/v1/alerts/webhookaccepts standard Alertmanager payloads - Auto-investigation — each firing alert kicks off a scoped ReAct investigation (by namespace / workload from labels)
- Playbook-first routing — hits deterministic runbooks before consulting the LLM (faster, cheaper, more predictable)
- Ranked notification — findings post back to Slack / PagerDuty (or any webhook) with root cause + suggested fix
- Concurrency caps + LLM offload — burst-safe: alert storms don't exhaust the model quota
📚 RAG Runbook Cache — Cached / Grounded / Cold
Every investigation runs through a 3-tier retrieval router before touching the model:
| Tier | Trigger | Behavior |
|---|---|---|
| Cached | Verified runbook match ≥ 0.92 similarity | Return the runbook answer verbatim — sub-second, near-zero cost |
| Grounded | Any relevant chunk ≥ 0.70 similarity | Feed retrieved docs into the LLM prompt as context |
| Cold | No relevant match | Full ReAct investigation from scratch |
Backed by Qdrant (self-hosted, no external SaaS) with a nightly ingestion CronJob for internal docs + configurable Git sources (URL-allowlisted). Every answer shows its citations — no black-box RAG.
🧠 Multi-Step Remediation Plans
Complex fixes get proposed as atomic multi-step plans instead of one-shot commands:
- LLM proposes plan → user reviews steps → each step needs its own confirmation token
- Dry-run first — every destructive step exposes its
--dry-run=serveroutput before real execution - Atomic step state — steps are
pending / running / done / failedwith concurrency-safe CAS transitions - Fail-safe — if step 2 fails, step 3 doesn't fire; users see the failure and decide next action
- Cancellable — abandon a plan mid-execution without leaving orphaned state
💾 Per-User Conversation Memory
The assistant remembers your prior investigation context across turns:
- Auto-captured — last 24h of namespace / pod / cluster mentions inform the next prompt
- Prompt preamble — memory is stitched into the system message, not the user message (invisible but effective)
- Bounded — 10 items per category, 5 rendered per turn, 24h max age, tenant-scoped
- Redacted — secrets pattern-matched and stripped before persist
✂️ Tool Result Summarization
Massive kubectl logs outputs get compressed intelligently:
- Heuristic first — strip ANSI, dedupe, tag errors/warnings, keep head + tail + relevant context
- LLM polish (optional) — condense multi-hundred-line describes into 3-line summaries
- Preserved evidence — every summary keeps the raw underlying data as an expandable "show all" section
👍 Feedback → Runbook Promotion
Thumbs-up on any answer promotes it into the cached-runbook tier:
- Great answers become verified runbooks other users hit via the "cached" tier
- Thumbs-down quarantines low-quality captures so they don't feed grounding
- Auto-capture classifier (strict-JSON Gemini prompt) decides which answers qualify for consideration
- Redaction runs before persist — secrets never enter the KB
🔐 Remote Diagnostics (Air-Gapped Clusters)
For clusters where you can't ship the assistant into the cluster:
- SSH + Ansible — runs a hardened, scoped diagnostic playbook against a bastion + target nodes
- Read-only by default — no writes without confirmation tokens; no shell access, only structured facts
- Egress-controlled — Helm ConfigMap + NetworkPolicy pin which nodes/subnets the runner can reach
- Auditable — every remote command emitted to the audit log
🔌 Pluggable LLM Providers
Pick your LLM — Google Gemini (default, free tier available), Anthropic Claude (Opus / Sonnet / Haiku), OpenAI (GPT-4o, or any OpenAI-compatible endpoint like Azure OpenAI / vLLM / LiteLLM), or Ollama (fully local — your cluster data never leaves your network). Set LLM_PROVIDER to gemini, anthropic, openai, or ollama and provide the matching API key.
🛡️ Safety First
- Read-only by default — all
kubectlcommands are validated before execution - Explicit confirmation required for write operations (
delete,scale,restart,patch) via slide-to-confirm - Full audit logging of every command executed
- RBAC-aware — respects your existing Kubernetes permissions
- Input validation — namespace/name/label-selector safety checks prevent injection
- Session isolation — temp kubeconfig files are scoped per session with
0600permissions, sanitized session IDs prevent path traversal, cryptographic session tokens prevent URL guessing - Command allowlist — the execute endpoint only accepts specific kubectl write prefixes; everything else is rejected
🚀 Deploy Anywhere
- Local dev — docker-compose one-liner
- Kind demo cluster —
make demospins up a broken cluster so you can see the tool work in 60 seconds - Production Helm chart — deploy into the same clusters it monitors
- SSH multi-cluster — query any remote kubeadm cluster without copying kubeconfigs
Which feature is right for me?
Match your situation to the feature that solves it:
| If you… | The feature | Enable with |
|---|---|---|
Just want an AI copilot for kubectl diagnosis |
Agentic ReAct + 51 tools | Defaults — no flags needed |
| Get paged by Alertmanager at 2 AM | Alert-Driven Auto-Investigation | ALERTMANAGER_WEBHOOK_ENABLED=true + set ALERT_WEBHOOK_TOKEN |
| Investigate the same failure modes repeatedly | RAG Runbook Cache (Cached tier) | RAG_ROUTER_ENABLED=true + 👍 on great answers |
Read 500-line describe and 10K-line log outputs |
Tool Result Summarization | ENABLE_LOG_SUMMARIZATION=true |
| Perform multi-step fixes with strong safety gates | Multi-Step Remediation Plans | ENABLE_RECOVERY_OPERATIONS=true + REQUIRE_DESTRUCTIVE_CONFIRMATION=true (default) |
| Have to repeat "the payments namespace" every prompt | Per-User Conversation Memory | On by default — persists 24 h per session |
| Want cluster investigation without shipping into the cluster | Remote Diagnostics (SSH + Ansible) | Configure remoteDiag block in Helm values |
| Have a team wiki that everyone should query first | Grounded RAG | Populate RAG_INGESTION_SOURCES and let the nightly CronJob index them |
| Need to see the AI's evidence before trusting an answer | Synthesis Critic + Citations | On by default whenever RAG is on |
| Run air-gapped and can't call Gemini | Ollama provider | LLM_PROVIDER=ollama — all inference stays local |
Quick Start
Option 1: Try the demo (60 seconds, no cluster needed)
Prerequisites: Docker Desktop, kind, kubectl
git clone https://github.com/kubeastra/KubeAstra.git
cd KubeAstra
make demo
Spins up a local kind cluster with pre-broken workloads (CrashLoop, OOM, ImagePull, stuck PVC) and launches the web UI.
Open http://localhost:3300 and ask "what's broken in the demo namespace?".
The demo generates its own kubeconfig automatically — it does not touch your host's current kubectl context. See
demo/README.mdfor full prerequisites and troubleshooting.
Option 2: Run locally against your own cluster
Prerequisites: a running Kubernetes cluster with kubectl access, and a Google Gemini API key (free tier) or Ollama running locally.
# 1. Configure the backend
cp ui/backend/.env.example ui/backend/.env
#    → set GEMINI_API_KEY (or LLM_PROVIDER=ollama) in .env

# 2. Start via docker-compose (kubeconfig mounted read-only)
cd ui
docker compose up --build

# 3. Open http://localhost:3300
Option 3: Use via MCP (Cursor / Claude Desktop)
cd mcp
./setup.sh        # creates venv, installs deps, writes MCP config entry
Edit mcp/.env:
GEMINI_API_KEY=your-key-here          # or LLM_PROVIDER=ollama
ALLOWED_NAMESPACES=prod,staging,default
Restart your IDE — all 51 tools appear as MCP tools.
Option 4: Use the CLI
For terminal-first workflows: a thin HTTP + SSE client for the backend, published as a standalone Python package.
pipx install kubeastra                # or: cd cli && pip install -e .

# assuming the backend from Option 2 is running on localhost:8000
kubeastra ask "why is checkout-service crashlooping in production?"
kubeastra investigate --pod api-gateway --ns production
kubeastra doctor                      # health-check CLI + backend + kubeconfig
Config lives at ~/.config/kubeastra/config.toml. Point at a remote backend with:
kubeastra config set backend-url https://kubeastra.mycompany.com
Full command reference in cli/README.md.
Option 5: Deploy to Kubernetes via Helm
Baseline install — chat UI + backend, no advanced features:
helm upgrade --install kubeastra helm/kubeastra \
  --namespace kubeastra --create-namespace \
  --set secrets.geminiApiKey="YOUR_KEY" \
  --set secrets.kubeconfig="$(cat ~/.kube/config | base64 | tr -d '\n')"
Opt into every Phase 1 feature (RAG runbook cache, Qdrant, ingestion CronJob, Alertmanager webhook, remediation plans) with the bundled overlay:
helm upgrade --install kubeastra helm/kubeastra \
  --namespace kubeastra --create-namespace \
  -f helm/kubeastra/values-production.yaml \
  --set secrets.geminiApiKey="YOUR_KEY" \
  --set secrets.kubeconfig="$(cat ~/.kube/config | base64 | tr -d '\n')"
Never commit secrets. Put
geminiApiKey,kubeconfig,alertWebhookToken, andqdrantApiKeyin a gitignoredvalues-secrets.yamland pass it via a second-fflag — seedocs/BEST_FEATURES_QUICKSTART.mdfor the full pattern.
How It Works
Every request flows through a fixed routing order — cheapest, most predictable paths first, LLM reasoning last:
- Connect your cluster — auto-detect your local kubeconfig, upload one, or enter SSH credentials. The connection is scoped to your session.
- Ask a question — "Why are pods in checkout-service not starting?"
- Memory injection — the last 24 h of your investigation context (namespaces, pods, cluster) is stitched into the prompt preamble so the assistant doesn't ask you to repeat yourself.
- Playbook-first check — if the question matches a deterministic runbook pattern (e.g.
OOMKilled recovery), the runbook answers directly. No LLM call. Sub-second. - RAG router — if no playbook matches, embed the query and search Qdrant across
runbook,devops_doc, andsession_memorycollections:- Cached (verified runbook, similarity ≥ 0.92) → return verbatim, sub-second, near-zero cost
- Grounded (any doc, similarity ≥ 0.70) → feed retrieved chunks into the LLM prompt as context
- Cold (no relevant match) → full ReAct from scratch
- ReAct investigation — the LLM reasons step-by-step: picks a tool → executes it → observes the result → decides the next action. Runs up to 6 iterations with a 90-second wall-clock timeout. Auto-discovery via
find_workloadhandles missing namespaces; large clusters use text-format parsing instead of JSON. - Tool result summarization — 500-line describes and 10K-line log dumps get compressed via heuristic (ANSI strip, dedupe, error tagging, head+tail+context) with optional LLM polish before entering the LLM's context.
- Synthesis critic — a hallucination auditor cross-checks the final answer against the raw tool evidence. Claims not backed by evidence are flagged or removed.
- AI synthesis — returns a severity-rated root-cause card with metrics, evidence, and either one-click fix commands or manual steps. Destructive ops require a dry-run first, then a single-use confirmation token.
- Persistence — every message, tool call, and result saved to SQLite so you can pick up where you left off. Session ID lets teammates load the full investigation.
- Auto-capture + promotion — a strict-JSON classifier decides which answers qualify for the cached-runbook tier. Thumbs-up promotes; thumbs-down quarantines. Secrets are redacted before persist.
- Alertmanager fan-in (optional) — POST to
/api/v1/alerts/webhookand every firing alert kicks off its own scoped investigation via steps 3–10 above, posting the finding back to Slack / PagerDuty.
Example Interactions
Quick listing — answered in one tool call, ~5 seconds:
You: what pods are in the jenkins namespace?
Astra: Here are the pods in the jenkins namespace.
       ┌─────────────────────────┬──────────┬───────┬──────────┐
       │ Name                    │ Status   │ Ready │ Restarts │
       ├─────────────────────────┼──────────┼───────┼──────────┤
       │ jenkins-0               │ Running  │ 2/2   │ 1        │
       │ avatar-agent-1s7k7      │ Pending  │ 0/0   │ 0        │
       └─────────────────────────┴──────────┴───────┴──────────┘
Deep investigation — multi-step ReAct, ~15 seconds:
You: why is mongo arbiter pod in crashloop?

Investigation Trail: 3/3 tools
  ✓ kubectl → pod status retrieved
  ✓ events  → events scanned
  ✓ ai      → analysis complete

┌─ CrashLoopBackOff ─────────────────────── CRITICAL ─┐
│ mongodb-arbiter-0 · infrastructure                   │
│                                                      │
│ The MongoDB arbiter pod is failing to start because  │
│ the designated primary host (mongodb-0) is not       │
│ available. The arbiter's setup process times out.    │
│                                                      │
│ ┌──────────┐ ┌──────────────────┐ ┌───────┐        │
│ │   360    │ │ CrashLoopBackOff │ │ False │        │
│ │ RESTARTS │ │      STATUS      │ │ READY │        │
│ └──────────┘ └──────────────────┘ └───────┘        │
│                                                      │
│ [Review & Execute Fix]                               │
└──────────────────────────────────────────────────────┘

Fix command: kubectl delete pod mongodb-arbiter-0 -n infrastructure
Cached runbook hit — sub-second, near-zero cost:
You: how do I recover from OOMKilled after a memory limit bump?

KB Router: cached (similarity 0.94 → runbook#412 "OOMKilled recovery")

Answer: Increase the memory limit on the Deployment and redeploy — the
        pod will be recreated with the new limit. If the workload is
        still OOMing after the bump, capture heap or profile before
        increasing further.

Citations: docs/runbooks/oom-recovery.md
Alert-driven auto-investigation — Alertmanager → root cause in under a minute:
[Alertmanager]  KubePodCrashLooping  →  POST /api/v1/alerts/webhook
                    ↓
KubeAstra opens an investigation session for {namespace, workload}:
  ✓ playbook-first hit: "CrashLoop w/ ImagePullBackOff" pattern matches
  ✓ investigate_pod → confirms ErrImagePull on payments-api:v42
  ✓ search_deployment_repo → v42 tag doesn't exist in registry
  ✓ synthesis critic → high-confidence finding

[Slack]  Root cause: image tag `v42` was never pushed. Rollback to
         `v41` or push the missing tag. (fix command staged for review)
Multi-step remediation plan — dry-run gate + per-step confirmation:
You: unstick the stuck Redis PVC blocking checkout-service

Plan proposed (3 steps):
  1. scale_deployment redis --replicas 0     [dry_run OK]
  2. delete_pvc redis-data --wait            [needs confirmation]
  3. scale_deployment redis --replicas 1     [chained to step 2]

You: confirm step 1
KubeAstra: ✓ scaled redis to 0/0 (ready in 4s)

You: confirm step 2
KubeAstra: ✓ deleted redis-data PVC (finalizer removed cleanly)

You: confirm step 3
KubeAstra: ✓ redis 1/1 running, checkout-service reconnected
Memory reuse across turns — the assistant carries context forward:
You: what's broken in the payments namespace?
Astra: 3 pods CrashLoopBackOff in payments — checkout-api, ledger,
       webhook-worker. Root cause: shared Redis dependency Pending.

You: fix it                                    ← no need to re-specify
Astra: [memory recalled: payments ns · redis PVC issue]
       Proposing plan to unstick Redis PVC (see previous investigation).
Configuration
All settings are read from environment variables (or .env):
| Variable | Default | Description |
|---|---|---|
LLM_PROVIDER |
gemini |
gemini, anthropic, openai, or ollama |
GEMINI_API_KEY |
— | Required when LLM_PROVIDER=gemini. Get one free |
GEMINI_MODEL |
gemini-2.5-flash |
Gemini model to use |
ANTHROPIC_API_KEY |
— | Required when LLM_PROVIDER=anthropic. Get one at console.anthropic.com |
ANTHROPIC_MODEL |
claude-opus-4-8 |
Claude model to use (claude-opus-4-8, claude-sonnet-5, claude-haiku-4-5-20251001, ...) |
OPENAI_API_KEY |
— | Required when LLM_PROVIDER=openai |
OPENAI_MODEL |
gpt-4o |
OpenAI model to use |
OPENAI_BASE_URL |
https://api.openai.com/v1 |
Override for OpenAI-compatible endpoints (Azure OpenAI, vLLM, LiteLLM, ...) |
OLLAMA_BASE_URL |
http://localhost:11434 |
Ollama server URL |
OLLAMA_MODEL |
llama3.1 |
Ollama model name (must be pulled first) |
ALLOWED_NAMESPACES |
* |
Comma-separated list, or * for all |
KUBECTL_TIMEOUT_SECONDS |
15 |
Per-command timeout |
MAX_LOG_TAIL_LINES |
200 |
Max log lines per request |
ENABLE_RECOVERY_OPERATIONS |
false |
Enables delete_pod, rollout_restart, scale_deployment, apply_patch |
REQUIRE_DESTRUCTIVE_CONFIRMATION |
true |
When enabled, destructive tools require dry_run first then a confirmation_token |
QDRANT_URL |
http://localhost:6333 |
Vector DB for RAG (use :memory: for tests) |
QDRANT_API_KEY |
— | Optional — required when Qdrant runs with authentication enabled |
RAG_ROUTER_ENABLED |
false |
Turns on the cached/grounded/cold retrieval router |
RAG_ROUTER_CACHED_THRESHOLD |
0.92 |
Similarity ≥ this on a verified runbook returns the cached answer |
RAG_ROUTER_GROUNDED_THRESHOLD |
0.70 |
Similarity ≥ this on any doc returns a grounded (RAG-fed) answer |
ENABLE_LOG_SUMMARIZATION |
false |
Compress large kubectl logs / describe output via heuristic + LLM polish |
SESSION_CAPTURE_ENABLED |
false |
Auto-classify answers for promotion to the runbook cache |
ALERTMANAGER_WEBHOOK_ENABLED |
false |
Accept Alertmanager webhooks on /api/v1/alerts/webhook |
ALERT_WEBHOOK_TOKEN |
— | Bearer token required on incoming Alertmanager webhook requests |
PROMETHEUS_URL |
— | Prometheus endpoint for prom_query (leave unset to disable) |
Repository Layout
kubeastra/
├── ui/
│   ├── frontend/                # Next.js chat UI (Astra Intent Light theme)
│   │   ├── app/chat/            # Chat page + /chat/:sessionId share routes
│   │   └── components/          # ClusterConnect, ResourceGraph, InvestigationTrail,
│   │                            #   CostBreakdownOverlay, YamlProposer, ApprovalOverlay, etc.
│   ├── backend/                 # FastAPI app + SQLite persistence
│   │   ├── routers/
│   │   │   ├── chat.py          # Chat flow, tool dispatch, fix execution
│   │   │   ├── cluster.py       # Cluster connection management (4 modes)
│   │   │   ├── sessions.py      # History, SSH targets, post-mortem API
│   │   │   ├── feedback.py      # Thumbs-up/down → runbook promotion
│   │   │   └── alerts_router.py # Alertmanager webhook + investigation fanout
│   │   ├── react.py             # ReAct loop orchestrator
│   │   ├── memory.py            # Per-user conversation memory
│   │   └── db.py                # SQLite with cluster_connections, user_memory tables
│   └── docker-compose.yml
├── mcp/
│   ├── mcp_server/              # MCP server (stdio + HTTP transports)
│   ├── http_mcp/                # HTTP MCP transport service
│   ├── k8s/                     # kubectl wrappers, SSH runner, validators
│   ├── ai_tools/                # Error analysis, fix playbooks, runbooks
│   ├── alerts/                  # Alertmanager domain, orchestrator, notifications, playbooks
│   ├── playbooks/               # Deterministic runbook engine (playbook-first routing)
│   ├── services/
│   │   ├── llm/                 # Gemini + Ollama providers
│   │   ├── rag/                 # Chunking, ingestion, router, capture, promotion
│   │   ├── summarizer/          # Log / event / describe summarization
│   │   ├── plans.py             # Multi-step remediation plans
│   │   ├── confirmation.py      # Dry-run + single-use confirmation tokens
│   │   ├── synthesis_critic.py  # Hallucination auditor
│   │   ├── tool_envelope.py     # Structured tool-response format
│   │   ├── error_parser.py      # kubectl error classifier
│   │   ├── prometheus.py        # Prometheus query client
│   │   ├── embeddings.py        # sentence-transformers wrapper
│   │   └── vector_db.py         # Qdrant client
│   ├── tool_registry.py         # Single source of truth: 51 tools
│   └── config/settings.py
├── helm/kubeastra/              # Helm chart — backend, frontend, Qdrant StatefulSet,
│                                #   RAG ingestion CronJob, NetworkPolicies
├── evals/                       # DeepEval baselines + eval runner
├── demo/                        # Kind + broken workloads for `make demo`
└── docs/                        # Public documentation
Roadmap
- Gemini + Ollama (local) LLM support
- Demo mode with kind cluster
- Approval flow for write operations
- Deployment-level investigation (
investigate_workload) - Namespace-wide health analysis (
analyze_namespace) - Agentic ReAct investigation loop (multi-step tool calling)
- Shareable session URLs + investigation timeline
- Auto-generated post-mortems from investigation sessions
- Visual debugging canvas (interactive resource graph with health glow, click-to-inspect, tooltips, MiniMap)
- Multi-modal cluster connection (auto-detect, kubeconfig upload, SSH, in-cluster)
- One-click fix execution with safety guards and slide-to-confirm
- Manual steps fallback when no automated fix is available
- Large cluster support (text-format parsing for all-namespaces queries)
- Session security hardening (path traversal prevention, cryptographic session IDs, command allowlists)
- Team playbook engine — deterministic runbook execution ahead of the LLM
- Alert-driven auto-investigation — Alertmanager webhook + concurrency-safe fan-out
- Multi-step remediation plans — atomic steps with per-step confirmation tokens
- RAG runbook cache — cached / grounded / cold retrieval router backed by Qdrant
- Tool result summarization — heuristic + optional LLM polish for large logs / describes
- Per-user conversation memory — 24h scoped context injected into the prompt preamble
- Feedback → runbook promotion — thumbs-up ships great answers into the cached tier
- Prometheus integration —
prom_queryfor range/instant queries during investigations - Remote diagnostics — SSH + Ansible playbook for air-gapped clusters
- Eval harness — deterministic offline + nightly LIVE regression tests for LLM decisions
- OpenAI + Anthropic Claude adapters (plus any OpenAI-compatible endpoint — Azure OpenAI, vLLM, LiteLLM)
- Loki / Tempo observability integrations
- "What changed?" view — recent deployments, ConfigMap/Secret mutations
- Real-time collaborative sessions (WebSocket sync + presence indicators)
- Slack bot integration (alert → investigation → findings in channel)
- PagerDuty / OpsGenie native adapters (Alertmanager works today; these would skip the webhook hop)
- CNCF Sandbox submission
Contributing
Contributions are welcome — especially the items at the top of the roadmap. See CONTRIBUTING.md for local setup, project layout, and how to add a new tool, and CODE_OF_CONDUCT.md for community guidelines.
Looking for a starter task? Check the good first issue label.
License
Apache 2.0 — see LICENSE for details.
Yorumlar (0)
Yorum birakmak icin giris yap.
Yorum birakSonuc bulunamadi